[Data Stories runs thanks to the help of our listeners. Please consider supporting us on Patreon or sending us a one-time donation through Paypal. And thanks so much for your support!]
We have Dominik Moritz, Jacob Vanderplas, and Kanit “Ham” Wongsuphasawat on the show to talk about Vega-Lite and Altair. Dominik and Ham are PhD students at the Interactive Data Lab at the University of Washington with Jeff Heer, and Jacob is the director of Open Software at the University of Washington’s eScience Institute and the main person behind the development of Altair, the porting of Vega-Lite to Python.
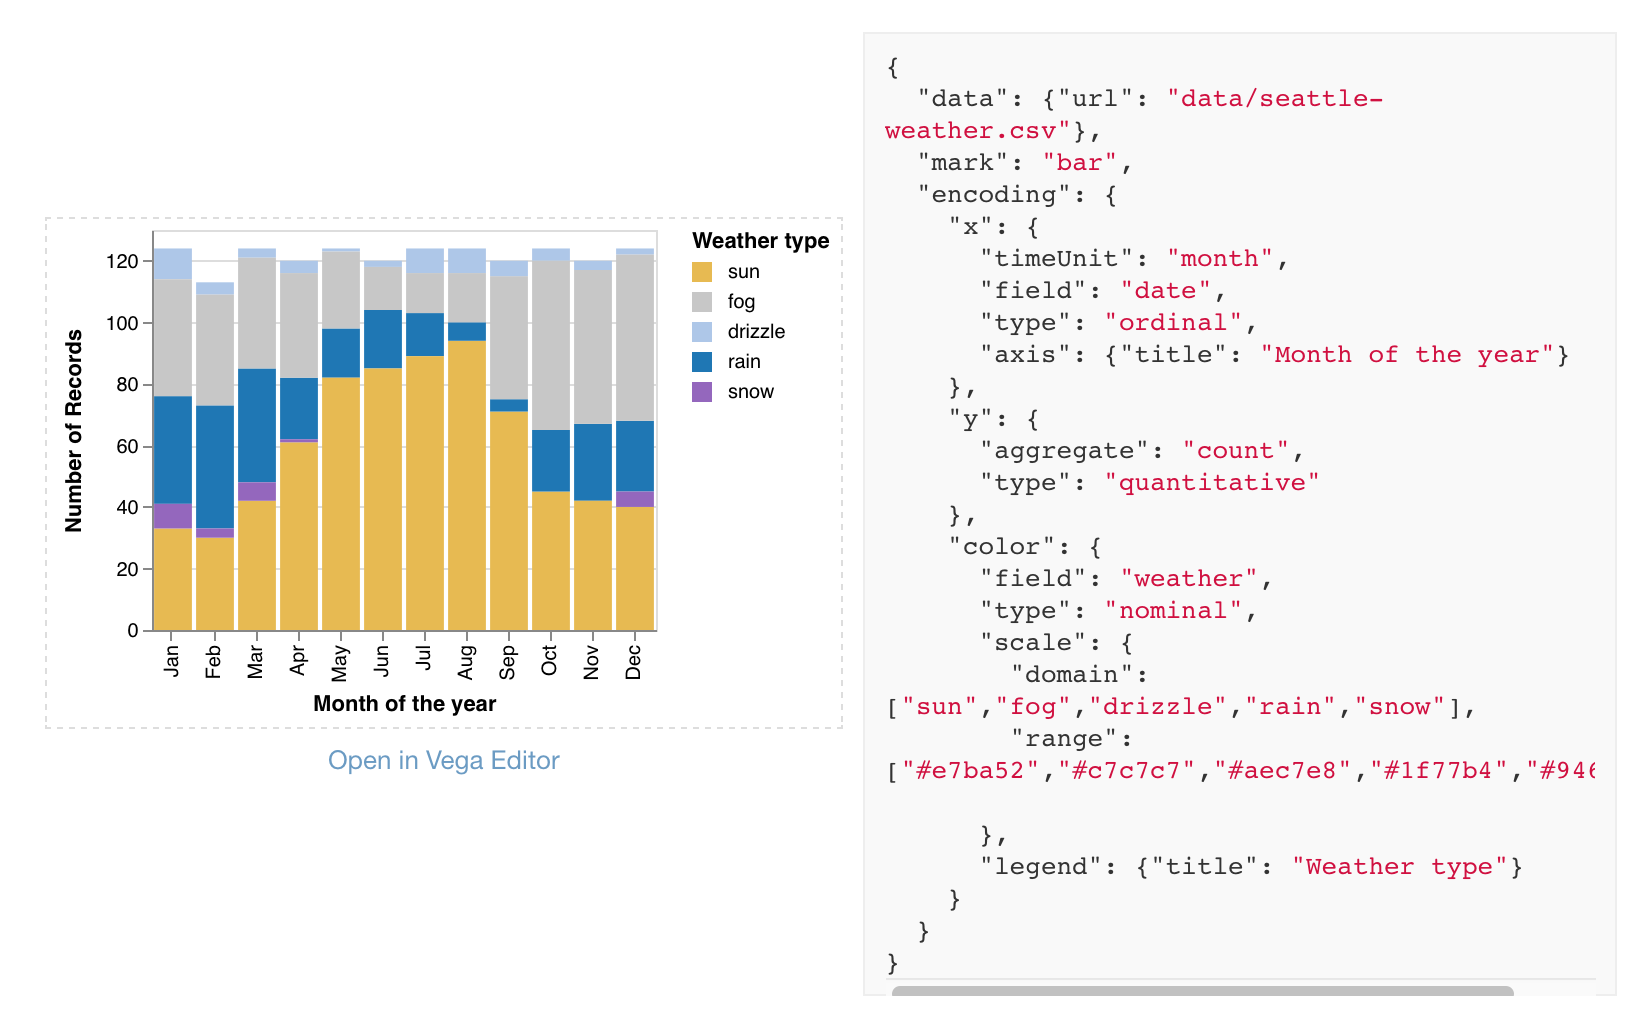
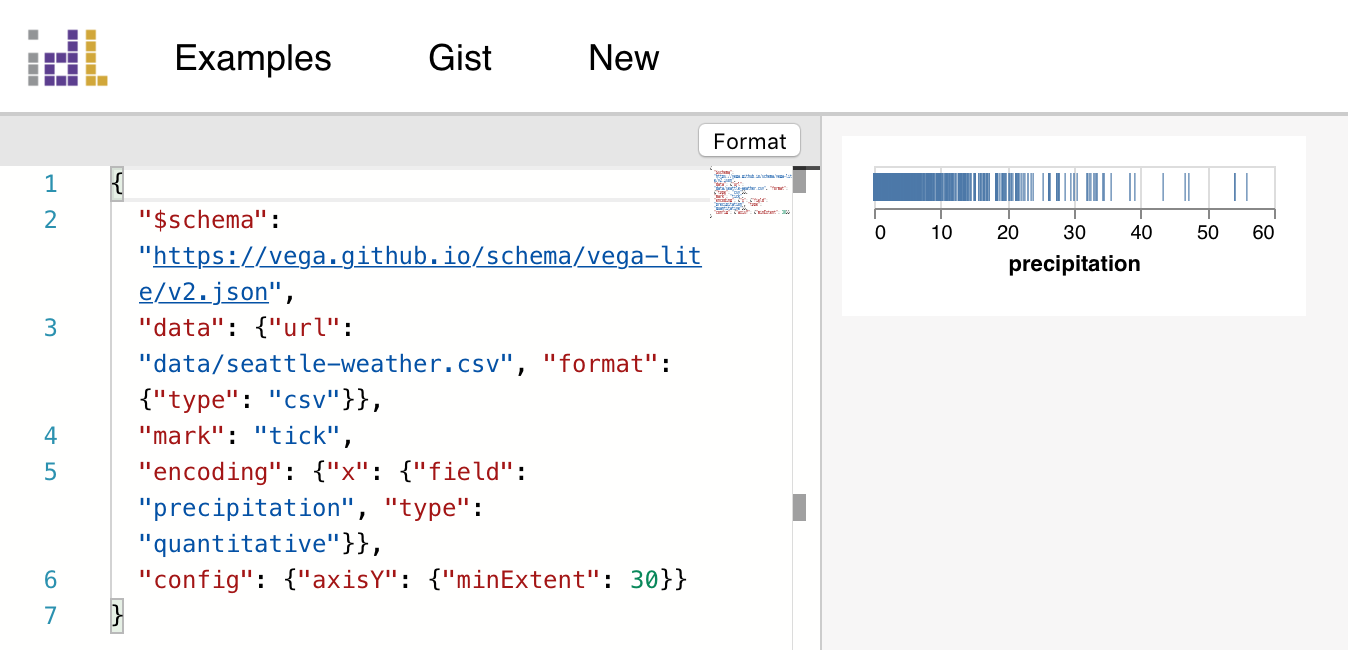
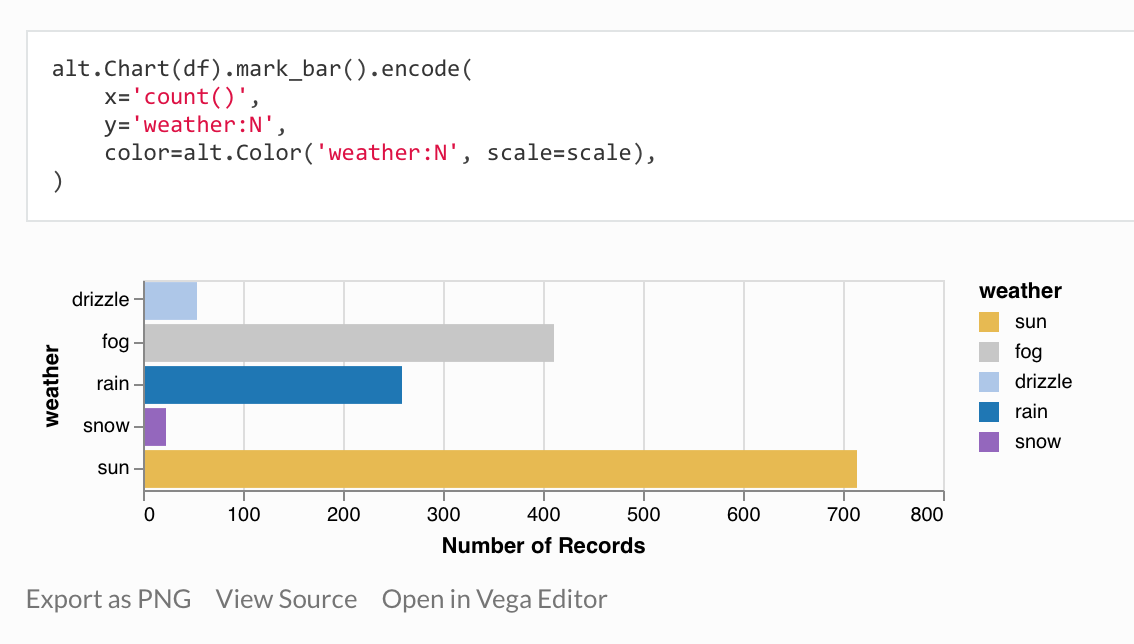
Vega-Lite is a new declarative language for the development of interactive data visualizations based on a grammar of graphics (similar to R’s ggplot2). One of the most interesting innovations it provides is the development of a grammar that also includes interaction and linking between views. In addition, Altair brings Vega-Lite to the Python environment, making it available to innumerable data scientists who work in Python and the Jupyter Notebook.
On the show we talk about these two new environments, the grammar used by Vega-Lite, how to get started with it, and more.
Enjoy the show!
Links